
Read the results
3 min read
Open the experiment’s Results tab. It compares every variant with the control on the primary metric, and updates as visitors arrive.
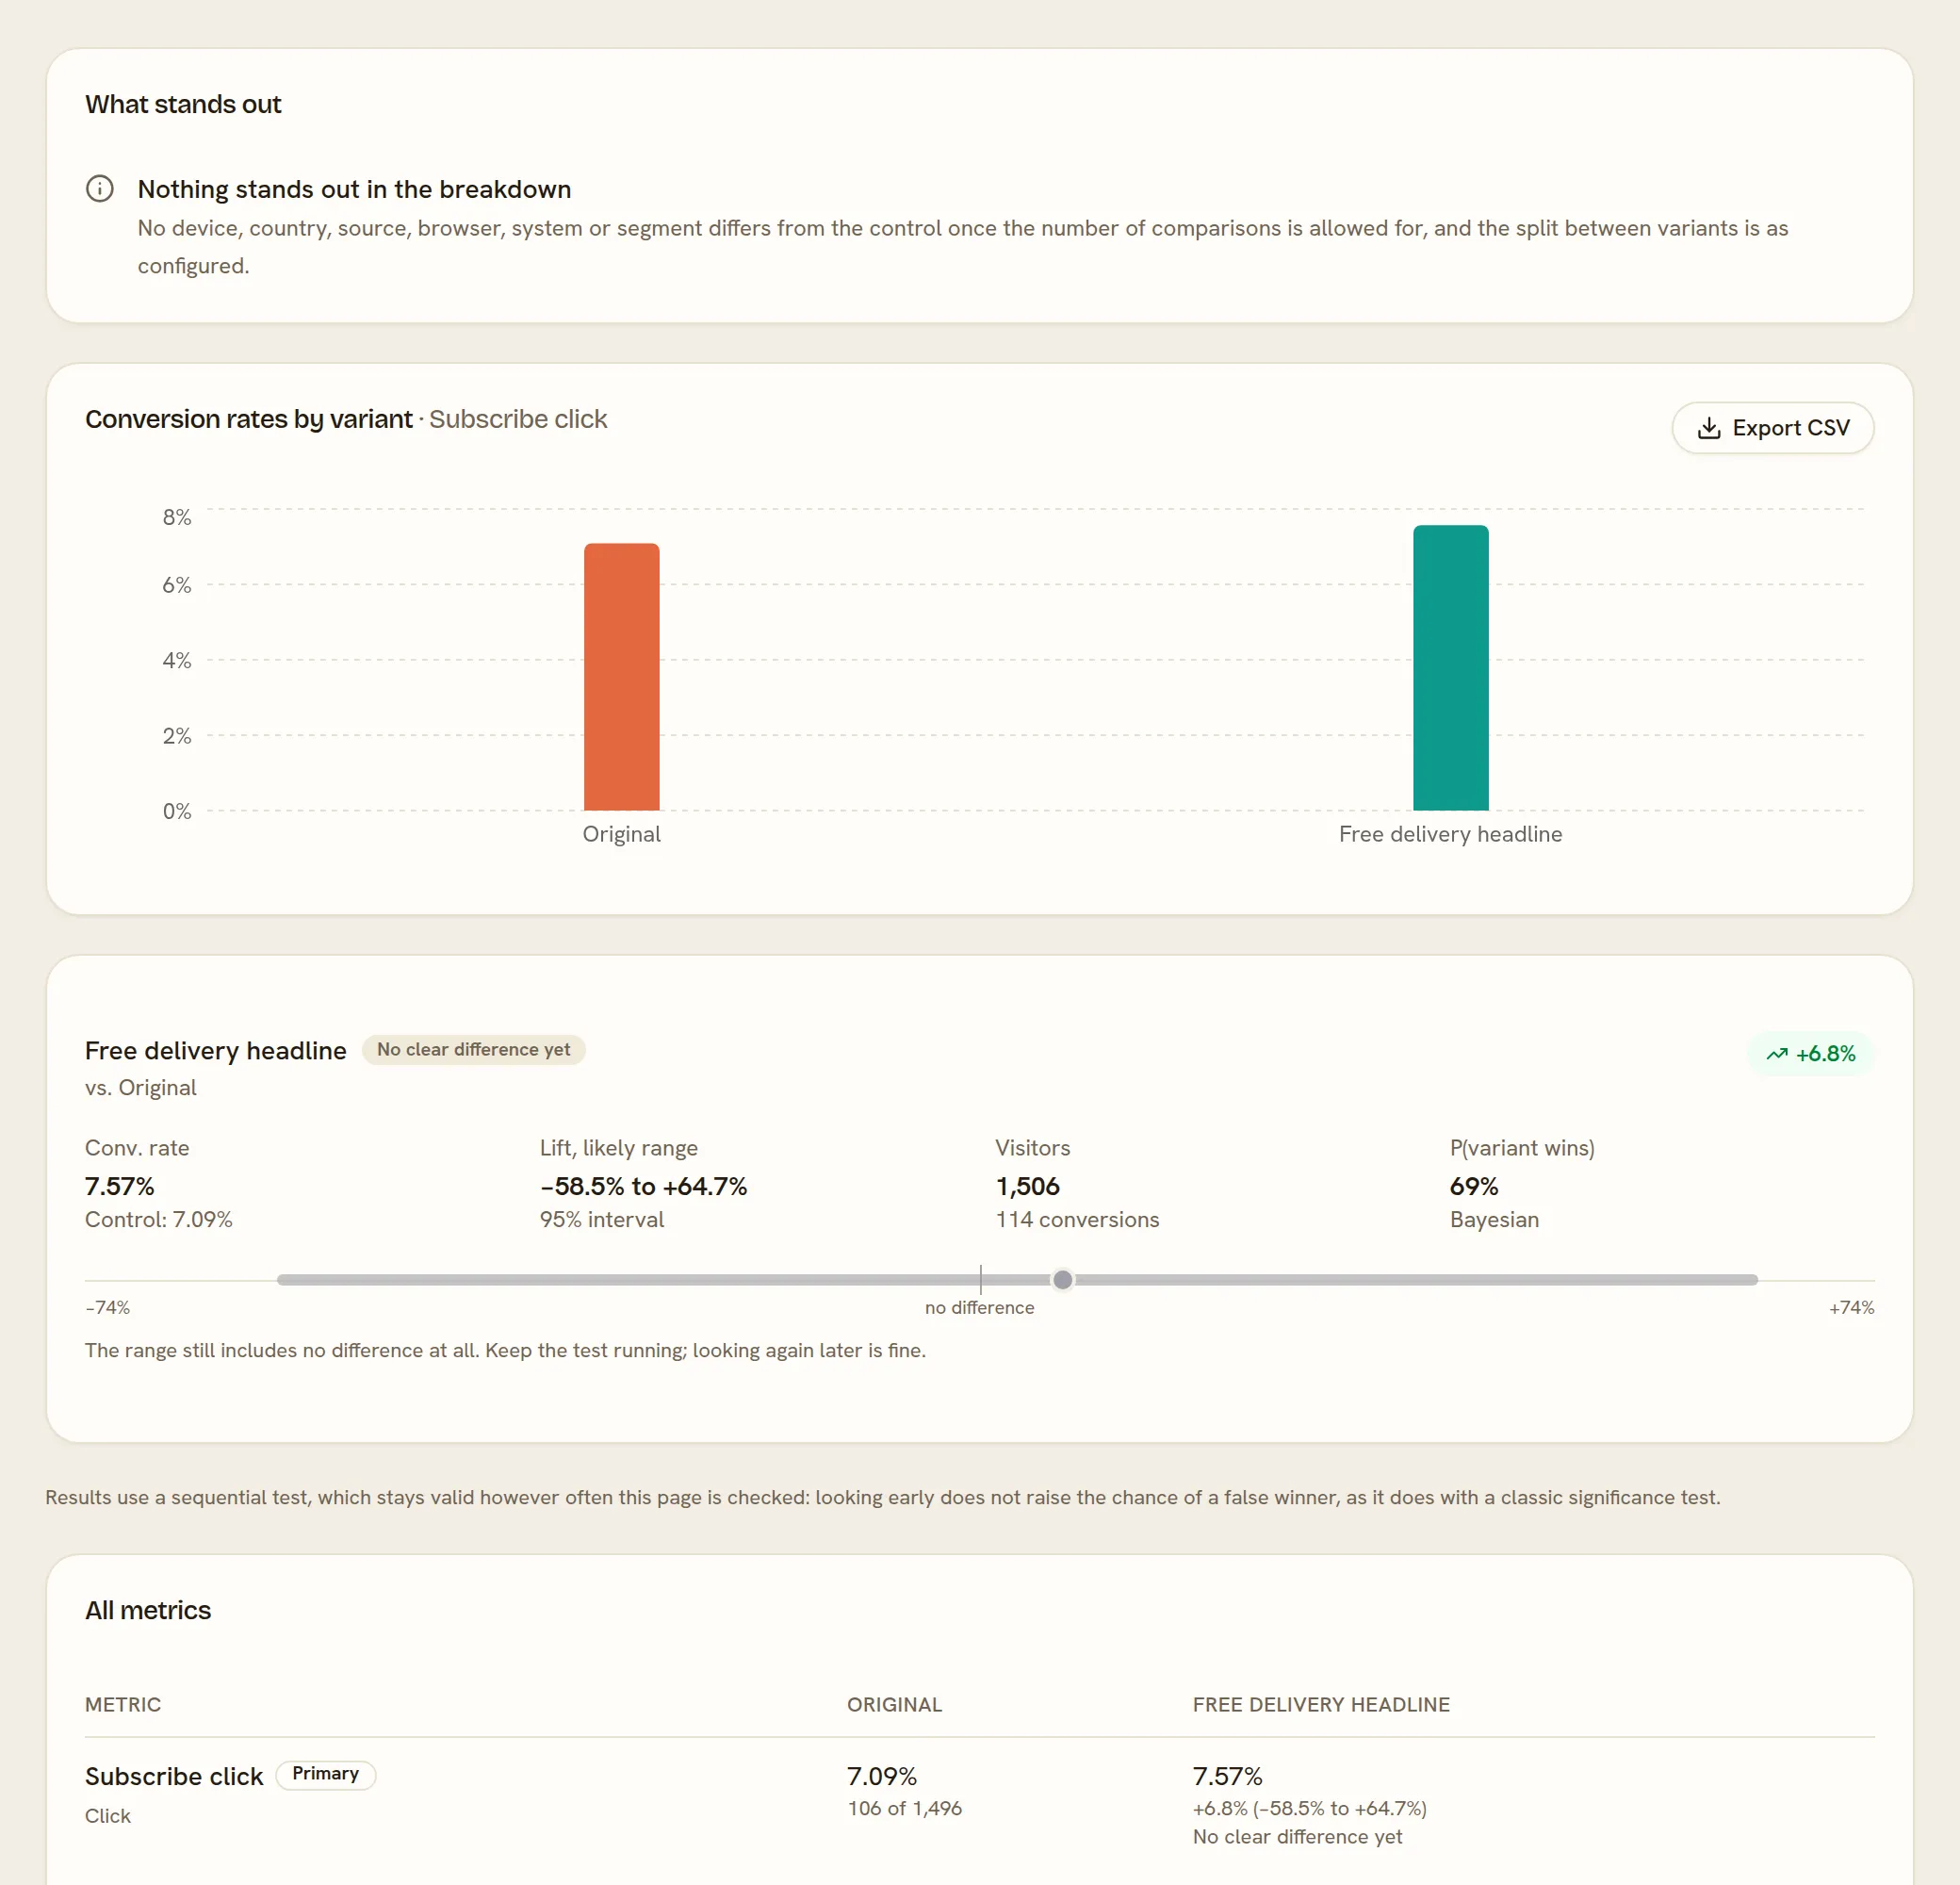
What the numbers mean
Section titled “What the numbers mean”For each variant, against the control:
| Figure | What it says |
|---|---|
| Conv. rate | The share of the variant’s visitors who converted. A visitor counts once however many pages they view, and a conversion counts once however many times they click. |
| Lift, likely range | How much better or worse the variant converts than the control, with the range the true difference most likely lies in. A range that crosses zero means the test cannot yet tell the two apart. |
| Visitors and conversions | The people the variant was shown to, and how many of them converted. |
| P(variant wins) | The chance the variant is better than the control, given the data so far. A second opinion, not the verdict. |
Each variant carries a verdict:
- Collecting data — too few visitors to say anything yet. AB Tester gives no verdict until each variant has 100 visitors and the comparison has 10 conversions.
- No clear difference yet — enough data to look, not enough to tell the variants apart. Keep it running.
- Better than control or Worse than control — the difference is large enough, for long enough, to be real.
When to decide
Section titled “When to decide”You can look at the results as often as you like. Most testing tools give more false winners the more often you check them; AB Tester’s test is built for checking every day and holds its error rate however often you look. So there is no need to wait for a fixed date before reading it.
Even so:
- Run for at least one full week, and preferably two. Visitors on a Monday morning behave differently from those on a Saturday night, and a week covers both.
- Do not stop at the first good day. A verdict only appears once the evidence holds up; No clear difference yet means wait, not “nearly there”.
- A test with no winner has still told you something: the change did not matter as much as you thought, and you can test something bolder.
What stands out, at the top of the tab, points out anything unusual: a split between variants that does not match the weights you set, which usually means something is broken, or a group of visitors, such as one device or one traffic source, that reacts differently from the rest. Treat the second as an idea for the next test, not a result.
Finish the experiment
Section titled “Finish the experiment”When the result is clear, the buttons at the top of the experiment offer two ways to finish:
- Deploy winner sends the winning variant to every visitor the targeting admits, while the experiment keeps running. Use it to give everyone the better version straight away, until your developers build the change into the site itself. The comparison stops at the moment you deploy. Once the change is built in, Complete the experiment.
- Declare winner records the winner and completes the experiment, which takes it off your site: visitors see the page as it is again. Use it when the winner is the control, or when the change is already built into the site.
Export CSV, on the results chart, downloads the numbers behind the page: a summary per variant, one row per day, and the breakdown by device, country, source and more.
You have run a complete experiment. From here, try a different type of experiment — a split URL test, a multipage funnel, a personalization or a feature flag — or narrow your next test to the audience What stands out pointed to.